
The macro-planning tool
An Excel dashboard that brings a project’s schedule, resource workload and estimate at completion together in one view.
Jean-Paul is a very busy project manager. Between a visit to the client’s platform, a department meeting, a technical meeting and an article to write for an upcoming trade show, when could he find time to review indicators in three sophisticated but disconnected tools, run simulations and report his forecasts to management?
He therefore asked his programme office, or PMO (Project Management Office), to prepare a simple dashboard: one view of the schedule, resource workload and estimate at completion, or EAC.
The dashboard fits on a single Excel worksheet, with a few simple formulas.
Open the macro-planning template in Google Sheets.
Three aspects of the project in one view
The high-level schedule
The schedule shows the duration and sequence of high-level tasks, which may be work packages assigned to a small team. It is a simplified Gantt chart.
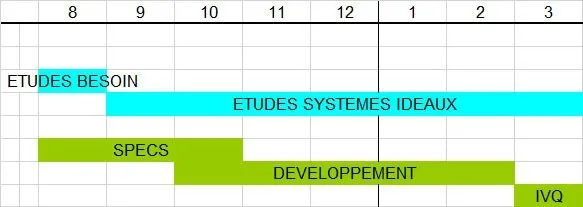
Simplified project schedule. Original illustration with French labels.
The team’s workload plan
Workload planning is particularly important for labour-intensive projects, such as software development. It allocates resources to high-level tasks and summarises the team’s workload.
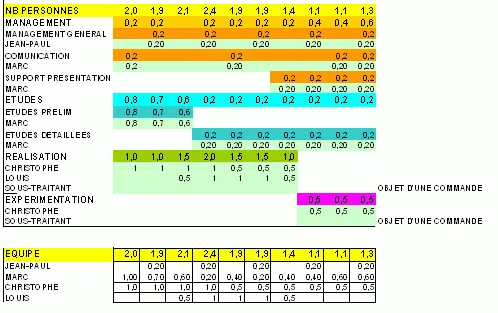
Workload plan in person-months. Original illustration with French labels.
Cost tracking
Workloads, expressed in person-months, are costed using the standard hourly rate. Actual costs (AC, labelled CPR or CR in the French example) are entered manually each month. The estimate to complete (ETC, or RAF) follows from the workload plan.
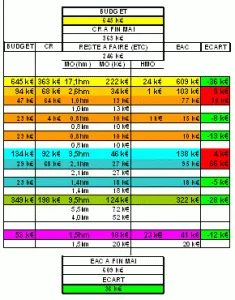
Project budget and estimates at completion. Original illustration with French labels.
The estimate at completion (EAC) is calculated automatically from actual costs and the estimate to complete. The difference from the budget is shown for the whole project and for each high-level task.
An overview for project control
This deliberately simple dashboard gives the project manager a high-level overview of the work packages. It complements the scheduling tool, which provides a more detailed view.
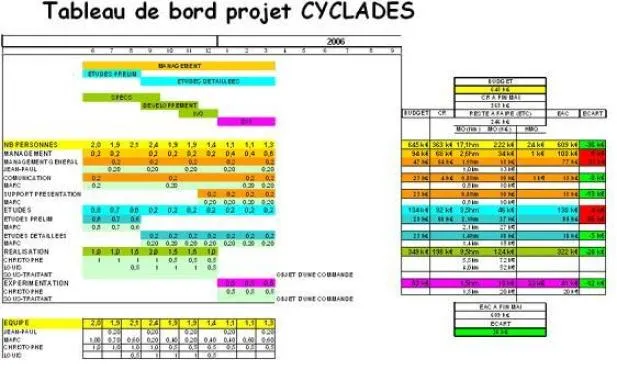
Dashboard overview: schedule, workload and budget. Original illustration with French labels.
- It can support preparation and verification of updates to the company’s reporting system.
- It helps check that total resource demand does not exceed availability.
- It enables simulations before entering data into the reporting system.
- It makes it easy to copy a summary view into PowerPoint, particularly for a project review.
These benefits lead Projiris to use the tool systematically on the small and medium-sized projects it supports. Explore our services.
Acronyms and the relationship between indicators
- Hm: the French abbreviation for person-months (hommes-mois).
- AC — Actual Cost (CPR or CR in French): expenditure already recorded.
- ETC — Estimate to Complete (RAF in French): the estimated cost and work remaining to finish the project.
- EAC — Estimate at Completion (CPE in French): the estimated total cost at completion, as assessed at the progress review.
The indicators are linked by:
EAC = AC + ETC, or CPE = CPR + RAF using the French abbreviations.