
PERT in practice
Build a project’s logical network, identify critical paths and float, and prepare a consistent schedule.
Building a PERT network is an essential step in structuring a project. It comes after the Work Breakdown Structure (WBS) and before the Gantt chart, commonly referred to as the schedule.
This is the stage that establishes the logical sequence of activities and gives the schedule its underlying logic.
Definition and principles
PERT stands for Program Evaluation and Review Technique. The method was used by the US Navy in 1958–1959 for the engineering of the Polaris weapons system. Its requirements were:
- Place all tasks in a network containing the activities and events defined in the WBS.
- Sequence events and activities according to a rigorous logic that allows one or more critical paths to be identified.
- Estimate each activity’s duration using three points: optimistic, most likely and pessimistic.
- Calculate the critical path and float.
Benefits and limitations
A PERT network reveals interdependencies and scheduling problems. It also allows the probability of finishing by a given date to be assessed, helping teams consider alternative plans. It can further help assess the effects of changes to the programme.
Its main limitations are complexity when the number of tasks exceeds roughly a hundred and the cost of maintaining the network.
Basic notation
- Events are represented by numbered circles.
- Activities are represented by arrows labelled with a duration.
- Relationships without an activity are represented by dashed arrows, known as dummy activities.
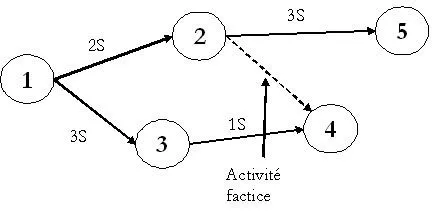
Activity-on-arrow PERT network. In the original French illustration, S denotes weeks and “activité factice” means dummy activity.
Activity-on-node representation
In an activity-on-node representation, tasks appear as boxes containing at least:
- The task name.
- The duration, in months, days or weeks depending on the level of analysis.
- Start and finish dates.
- Optionally, the amount of work.
Arrows represent the relationships between activities.
Practical guidance
Keeping the number of displayed tasks to around fifty helps make a network readable. For a small project or a work package within a large project, the network should fit on an A4 sheet. In a vertical layout, input milestones can be placed at the bottom and output milestones at the top.
Phase 1 — Internal dependencies
Start with relative dates, for example measured from the project award. Focus on internal dependencies and identify internal critical paths.
Phase 2 — External dependencies
Then incorporate external dependencies and identify the resulting critical paths.
The critical path is the sequence of tasks that determines the minimum project duration. A critical task has no float: its earliest start date equals its latest start date.
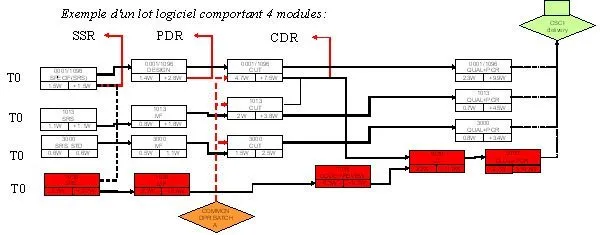
Example of a software work package with four modules. Original illustration.
Network exercise
What is the float of activity G in the network below?
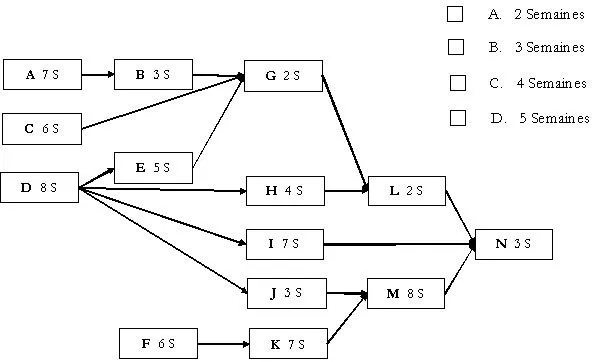
The possible answers are 2 weeks, 3 weeks, 4 weeks or 5 weeks. In the original illustration, “S” and “semaines” mean weeks.